Source Information
The following metrics are sourced from truck driver recruiting campaigns managed by Randall Reilly. Recent trends are detailed below to review driver employment activity.
In the past 12 months, the network of unique driver recruiting landing pages maintained by Randall Reilly has been visited by over 6.64 million users. 5.76 million users visited using a mobile device, 774k visited using a computer, and 124k visited using a tablet.
For Driver Recruiting campaigns managed by Randall Reilly, in the past 12 months:
- Drivers submitted 1.25 million unique leads to 878 different clients through Randall Reilly advertising campaigns.
- 391k unique driver contacts submitted 695k unique short forms to fleets.
- 389k unique driver callers made 550k unique call leads to fleets
Summary
Drivers’ high job search intent continues to keep lead costs at levels not seen since the pandemic-disrupted months in 2020: drivers are converting on recruiting landing pages at the highest rate on record. That great conversion rate, combined with low click costs, has resulted in an overall average cost per lead that has remained lower than at any extended stretch for the past two years.
The uncertainty in the trucking market is affecting the average hire costs for company drivers and owner-operators in diverging ways: the current driver market is beneficial for those looking to partner with owner-operators, but it can be frustrating for those trying to hire quality company driver candidates.
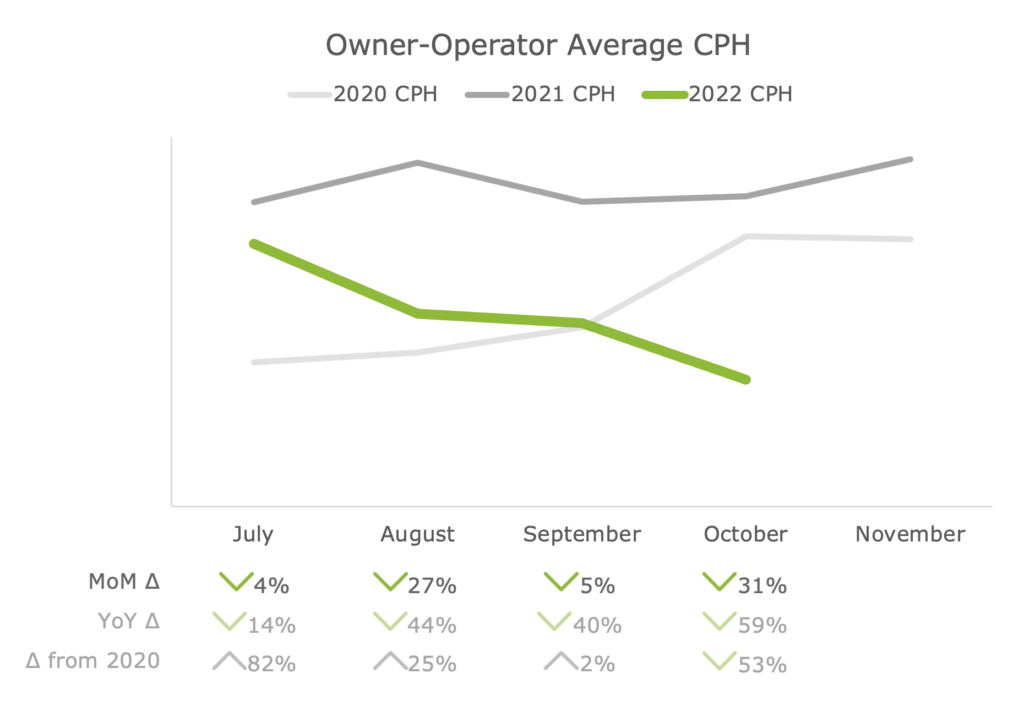
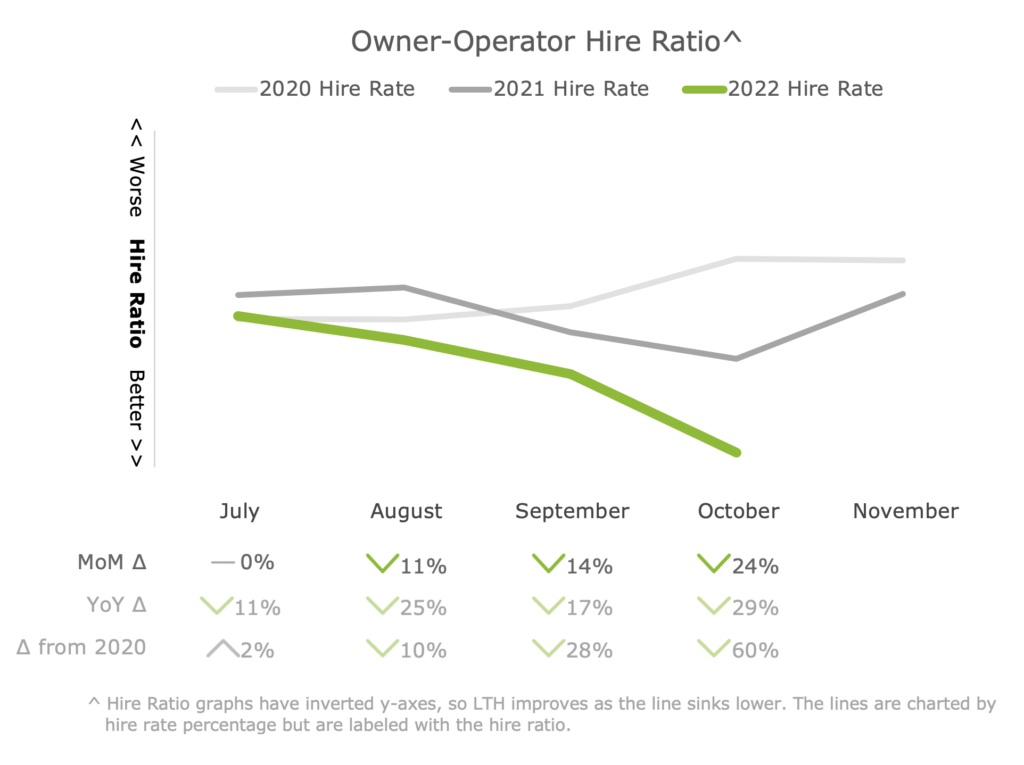
- The lead-to-hire ratio (LTH) in October for owner-operator campaigns fell to its best level on record, causing cost per hire (CPH) to drop to its second-lowest level on record.
- As spot rates have fallen, diesel prices have risen, and freight uncertainty has increased, owner-operators have been much more interested in partnering with a carrier to mitigate risk.
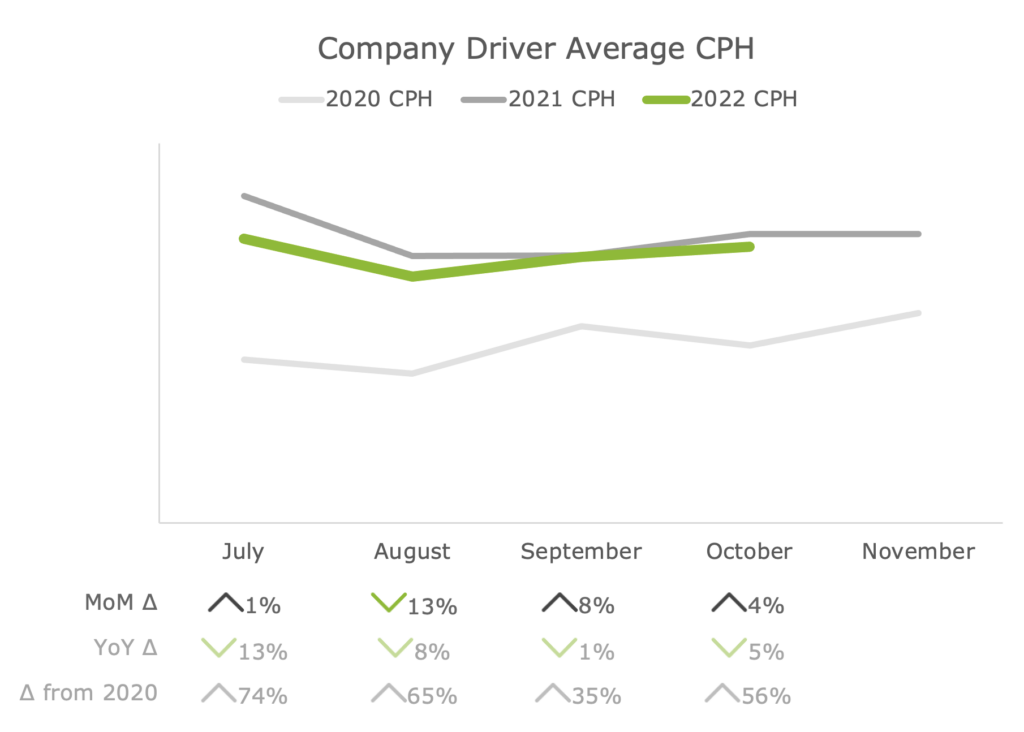
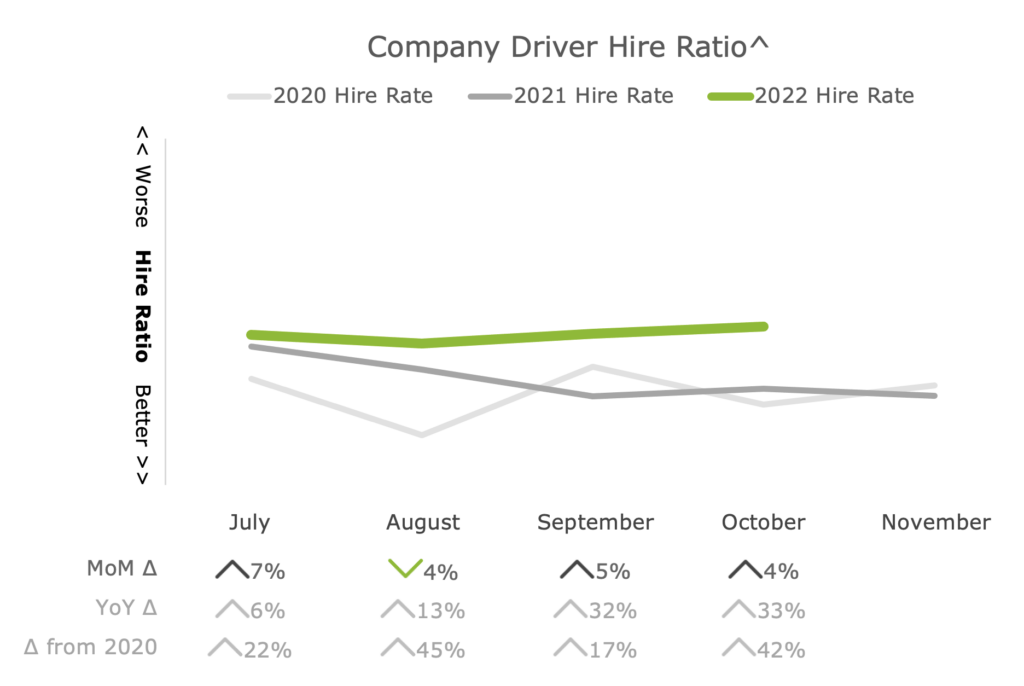
- Conversely, October’s LTH for company driver campaigns rose to its highest level since May 2020.
- Market uncertainty is causing some carriers to curtail hiring efforts and even lay off some drivers, releasing drivers with little or problematic driving histories back into the job market. Carriers partnered with Randall Reilly are giving anecdotes of being flooded with applications from drivers with a poor driving record that they don’t have an interest in hiring.
Click Cost Averages
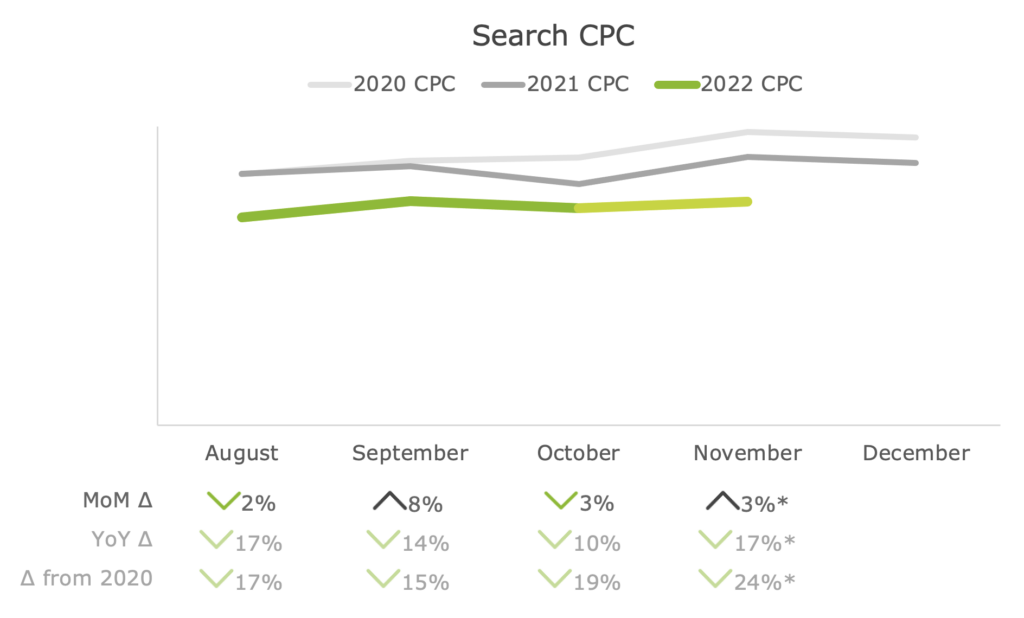
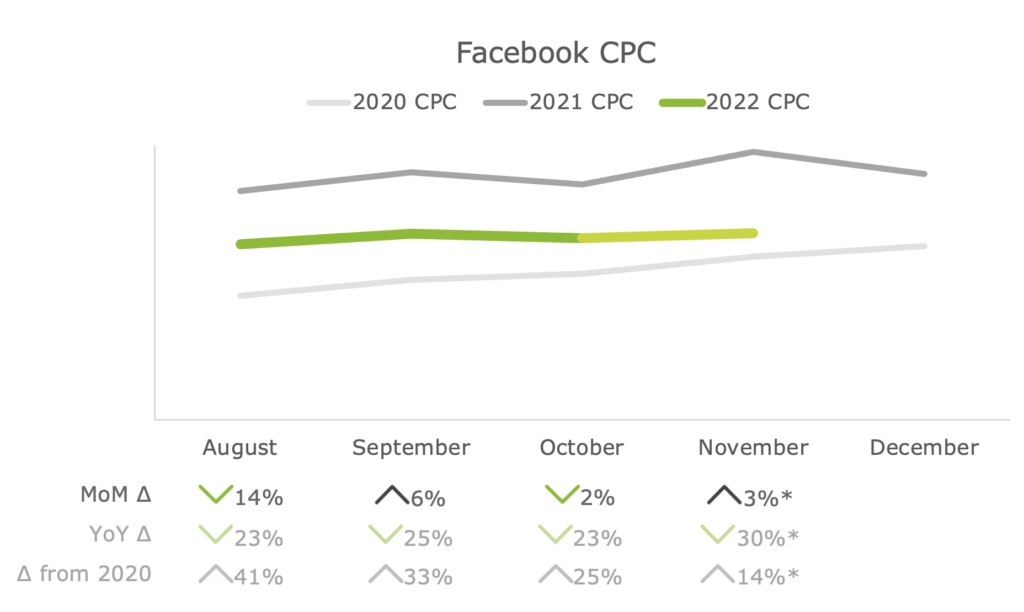
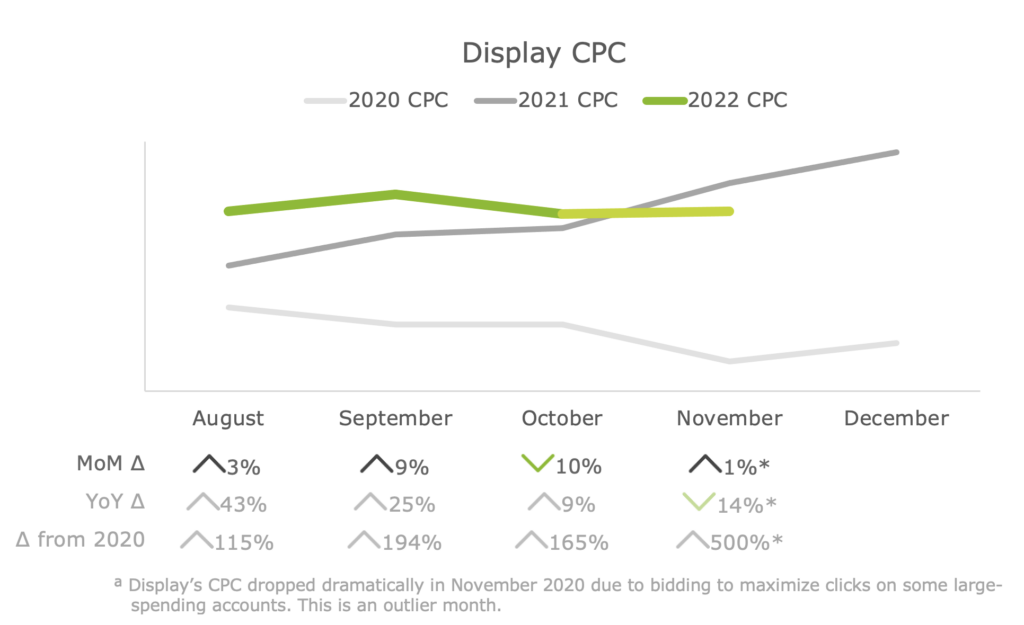
Click costs (CPC) are on pace to tick up between 1% and 3% in November[1], which is a smaller increase than usual for November. Search and Facebook click costs remain lower than they have been in the past few years, and in November, Display costs are on pace to be lower year-over-year for the first time since January 2021.
Note: Historical Search and Display data were updated, so 2021 and 2022 data have changed from past months’ reports.
Cost Per Lead Averages
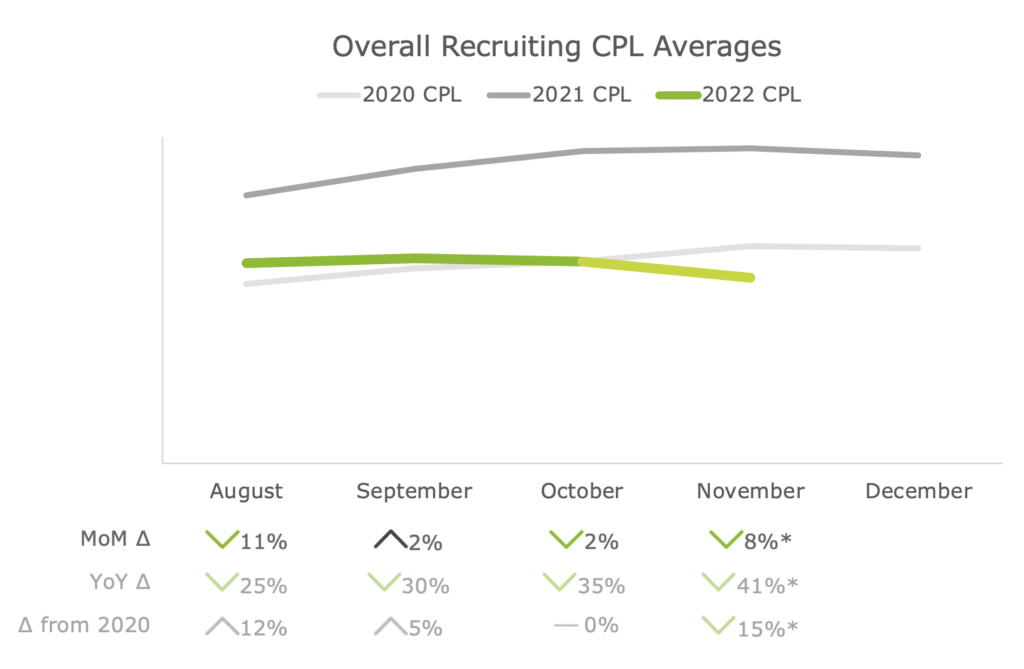
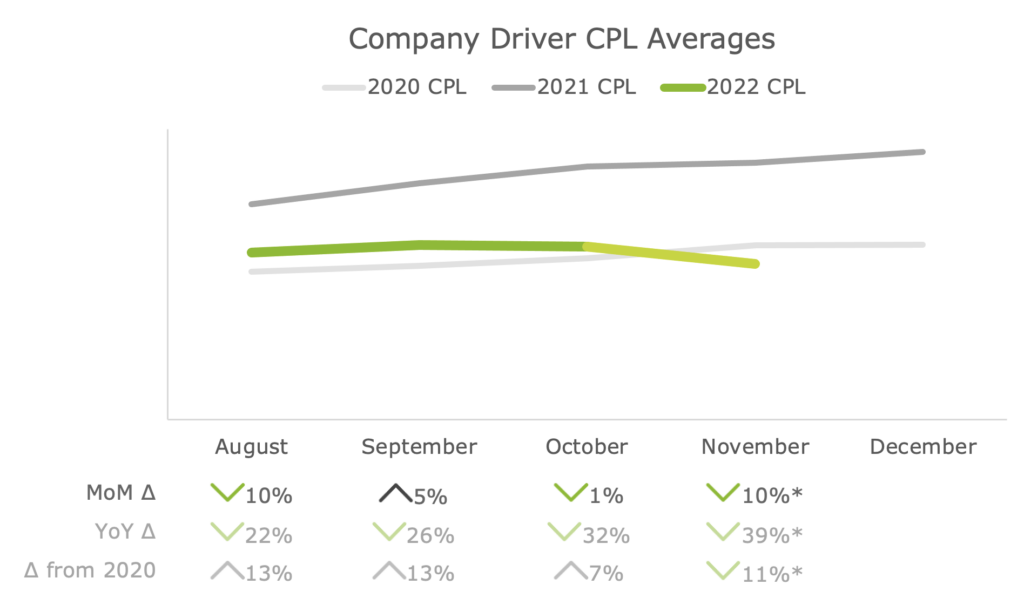
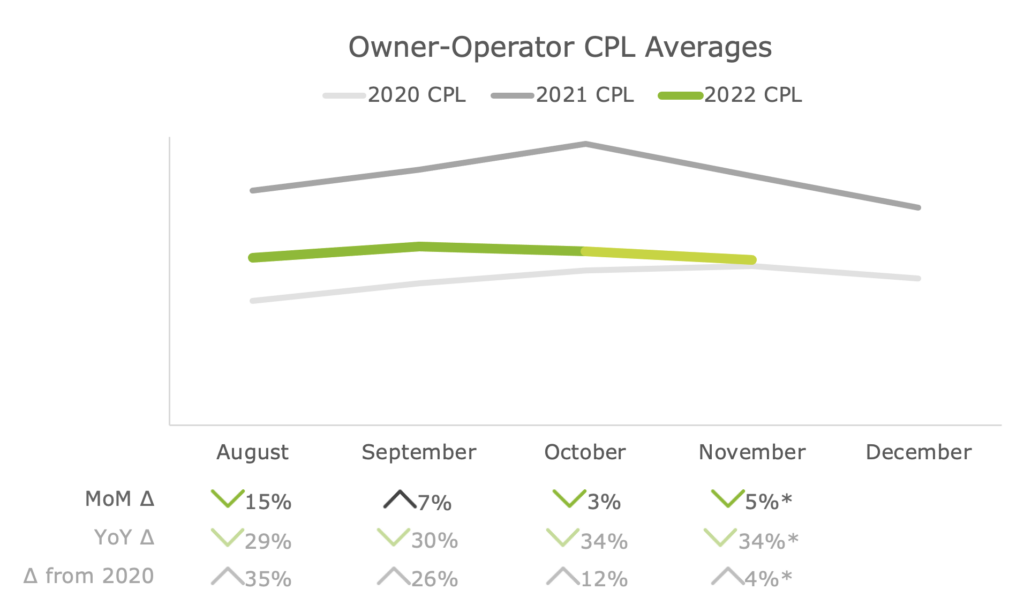
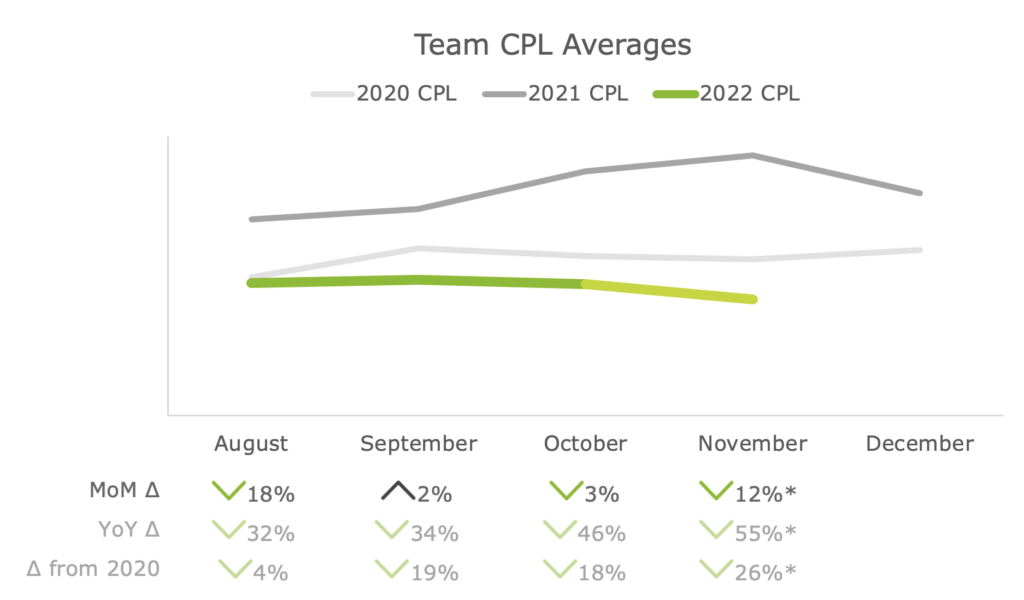
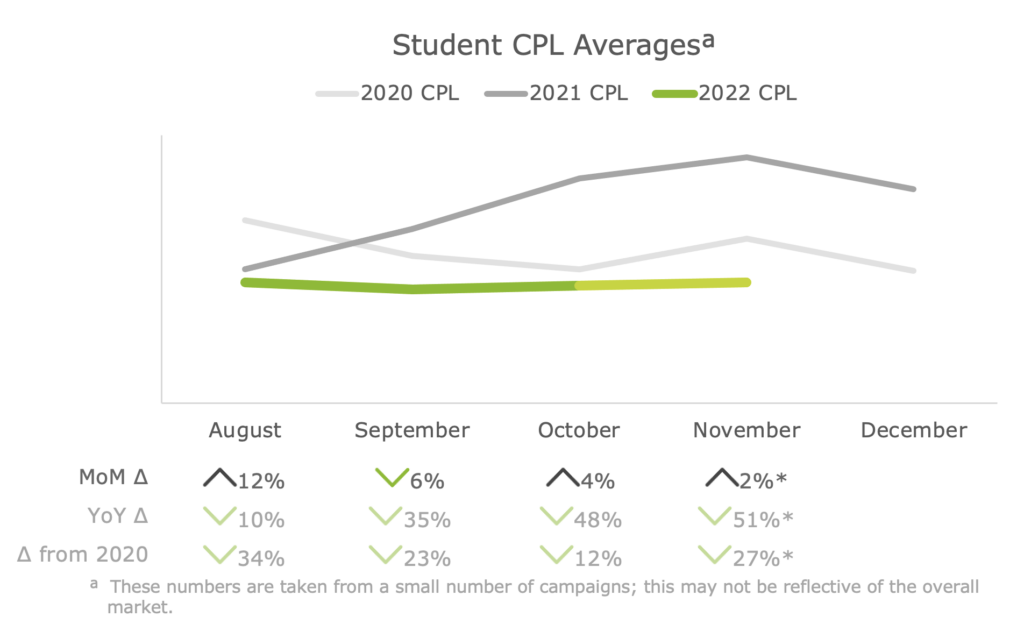
Recent months’ overall average cost per lead (CPL) has hovered around a level not seen consistently since the autumn of 2020. Through the first half of November, the overall average CPL is on pace to be lower, but historical performance over the week of Thanksgiving shows that lead costs increase in that week. Expect November’s CPL to end up being equal to October’s CPL or a percentage point or two higher.
All tracked experienced driver types have held quite steady over the past few months, and that trend appears to be continuing in November.
Hire Costs & Rates
The shifting trucking market is affecting the average hire costs for company drivers and owner-operators in diverging ways: the current driver market is beneficial for those looking to partner with owner-operators, but it can be frustrating for those trying to hire quality company driver candidates.
This year, as spot rates have fallen, diesel prices have risen, and freight uncertainty has increased, owner-operators have been much more interested in partnering with a carrier to mitigate risk. October’s hire cost (CPH) and lead-to-hire ratio (LTH) reflect that: preliminary hire data shows that owner-operator CPH is at its second-lowest level on record, while its LTH is by far at its most favorable level on record.
While it may at first seem counterintuitive, the uncertain freight market is contributing to a frustrating hiring situation for carriers looking to hire company drivers. Some carriers are curtailing hiring efforts and even laying off some drivers, decreasing competition for drivers. Carriers partnered with Randall Reilly are giving anecdotes of being flooded with applications from drivers with a poor driving record who have recently been let go and are looking for a new driving job. As a result, company driver LTH has ticked up to its highest level since May 2020. The high lead-to-hire ratio is causing company driver cost per hire to increase to its highest level since July. It is worth noting that October’s calendar was a favorable month for hiring with five Mondays and no long weekends. Conversely, November and December’s hiring efforts will be impacted by holidays. So, if other factors remain equal, expect CPH to increase.
Other Digital Trends
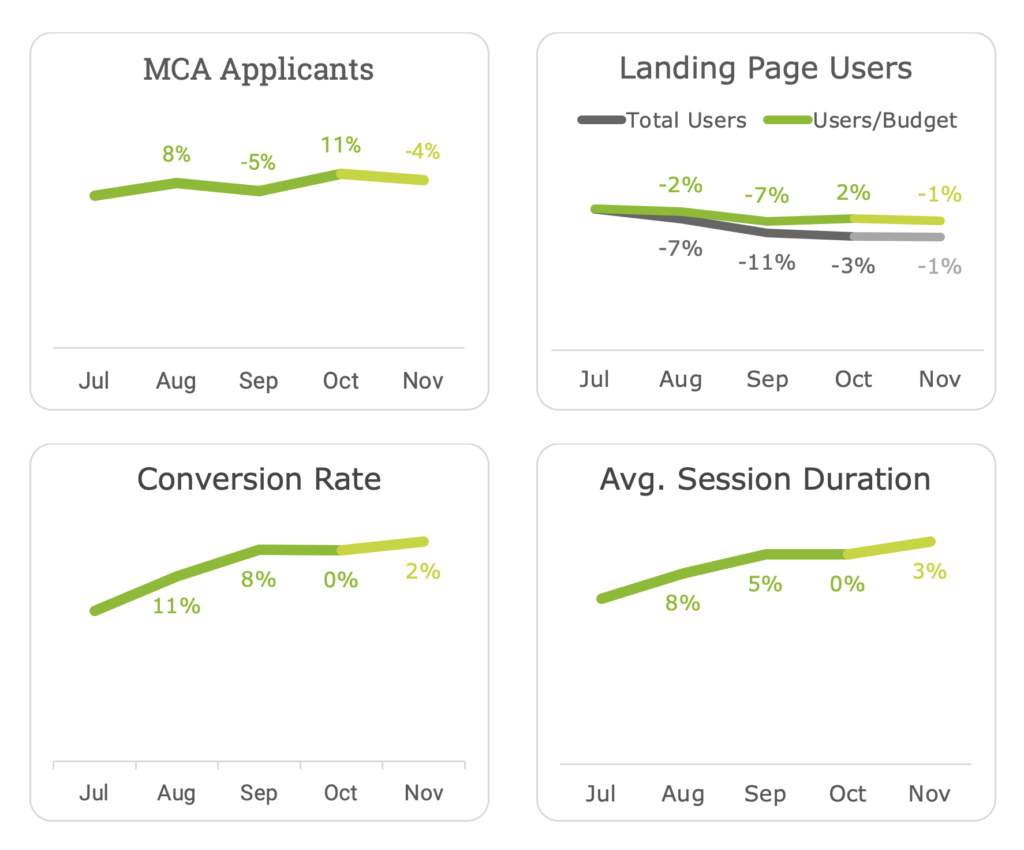
Behavior on recruiting landing pages continues to show that there are slightly fewer drivers coming to recruiting landing pages, but those that are coming to the pages have a high intent in their job searches. The conversion rate on landing pages continues to tick up ever further from their already very high levels to its highest point on record.
External Market Trends
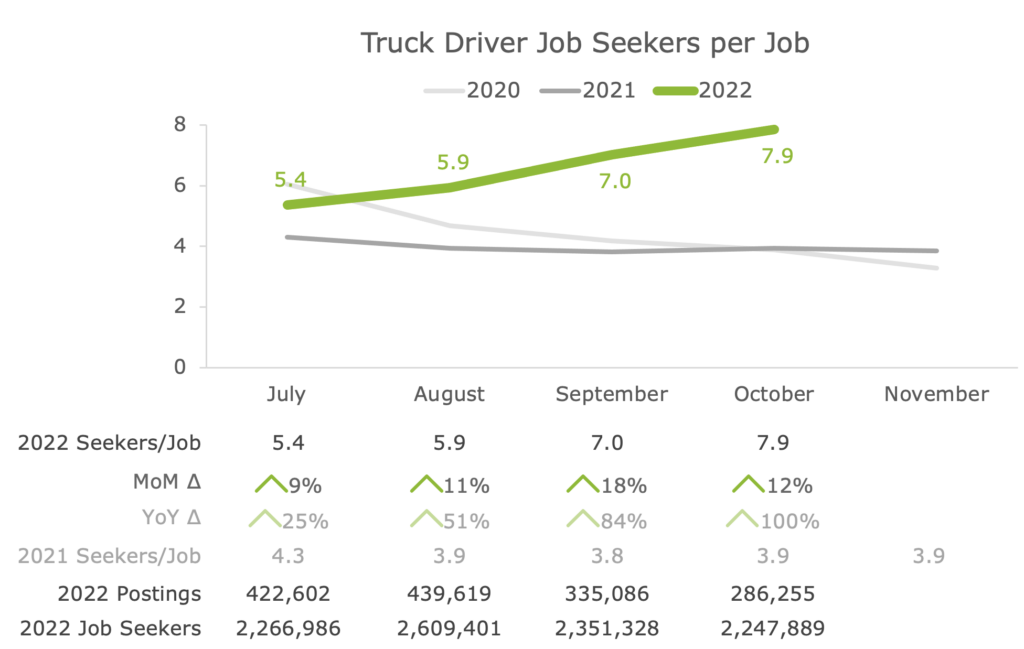
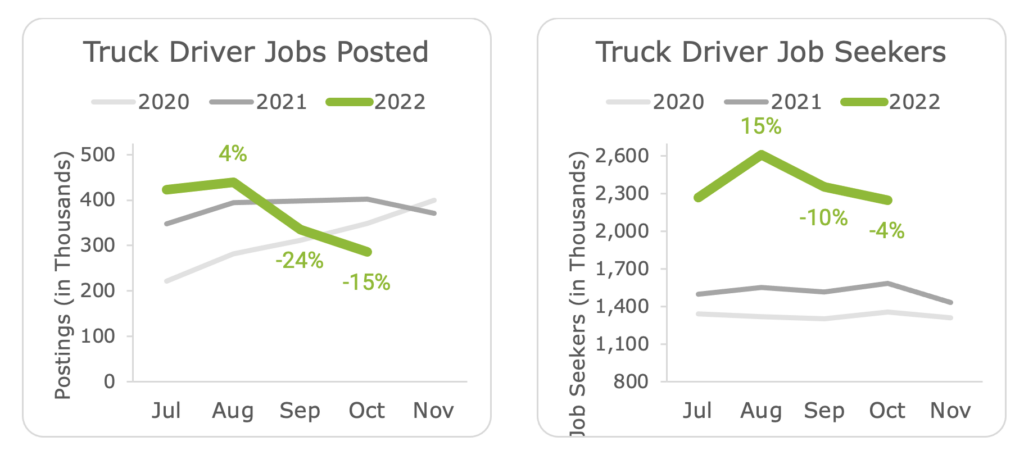
In October, the number of job postings for truck drivers dropped 15% from September, and there are now over 150,000 fewer truck driver job postings than there were just two months ago.
The large drop in the number of jobs posted has caused the number of seekers per job to spike to its highest level since January 2020.
Comparing October 2022 to October 2019 (for a pre-pandemic comparison), this past month there were 47% more people searching for driving jobs (+719,000), while there were 54% more jobs available (+100,000) for these searchers.
Market Information
FTR continues to report that trucking conditions are currently negative for carriers. Their Trucking Conditions Index has now had a negative reading for the past five months, and FTR forecasts negative conditions for carriers through at least the end of 2023 as the high cost of capital and lower rates will make it difficult for carriers.
FTR expects truckload rates in 2022 to decrease by 0.7% YoY excluding fuel, down just a bit from -0.6% YoY in their previous estimate. Spot rates are expected to fall 14.8% YoY, while the forecast for contract rates is +8.2% YoY. FTR’s forecast for truckload rates in 2023 is a drop of 7.7%, as spot rates are expected to decrease by 13.1% while contract rates are predicted to drop by 5.0%.
In contrast, FTR expects LTL rates in 2022 to increase 13.8% YoY, down from +14.2%. Their forecast for 2023 is a decrease of 4.8%, down from -4.0%.
FTR forecasts total truck loadings to increase 2.5% YoY in 2022, up marginally from +2.4% YoY in the prior forecast. This was the first improvement in months. For 2023, they expect a 0.9% increase in loadings, down from +1.2% in their previous forecast.
After losing 9,500 seasonally adjusted jobs in September, truck transportation employment rebounded by adding 13,200 seasonally adjusted payroll jobs last month. October has the highest seasonally adjusted truck transportation employment number on record. Since these employment figures do not count owner-operators, it is likely that we are seeing complexities with self-employed drivers shifting back to working with carriers as employees rather than overall capacity increasing.
FTR’s forecast for active truck utilization has changed little in the near term, but it begins to weaken slightly prior to the relative forecast by late 2023. Utilization should stay close to 10-year-average levels for most of 2023 before it begins to move higher by mid-2024. It should remain several points above the bottom of the 2019 market.
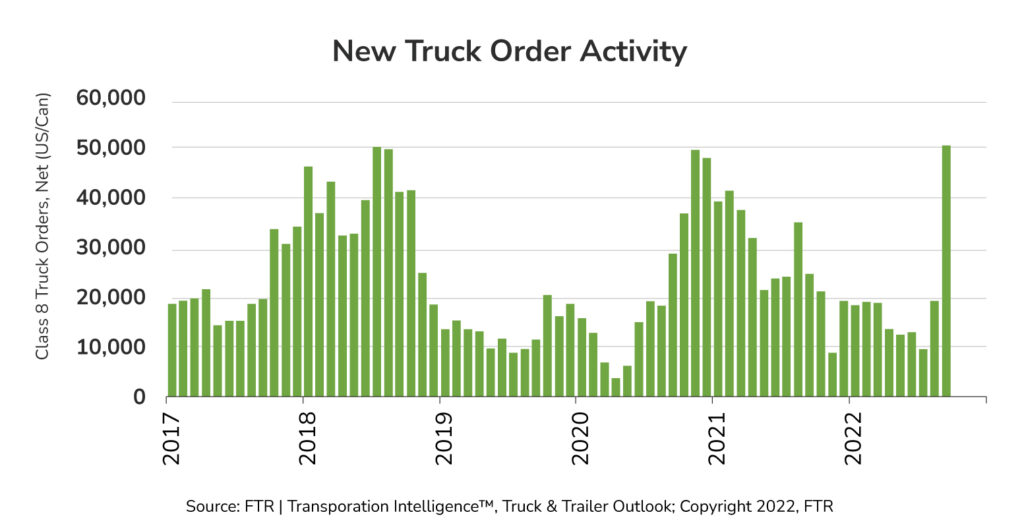
Truck production increased by 16% in September and continues to show signs of strength. OEMs opened build slots for 2023 and accepted orders, which caused Class 8 net orders to jump to their highest level on record (over 50,000 orders for U.S. and Canada combined). U.S. orders were up 161% MoM and 92% YoY. The surge in truck orders caused the estimated average time from order to delivery to increase to 7.5 months from 6.9 months in August.[2]
Fill out the form below to download a full copy of the November 2022 Driver Recruiting Trends Report.

[1] All of November’s stats are taken from campaign performance from November 1 to 15.; all others are taken from September 1 to 15.
[2] Market information is taken from: FTR. “Trucking Update: October 2022.” 30 Sep 2022, FTR.
Miller, Jason. “Truck Transportation Employment.” Nov 2022, LinkedIn.U.S. Bureau of Labor Statistics. “Truck Transportation: NAICS 484 Workforce Statistics,” 16 Nov, BLS.


